Am I actually beating the market, or is this just inflation?
Upload the CSVs your broker already gives you and see what your money actually earned. Omnicogi keeps Clean Cash apart from Generated Wealth, pools your gains under Section 104, and models the ISA Bridge to early retirement, with no broker or bank logins.
No broker logins required · Free until 5 April 2027 · Seamless desktop & mobile sync
Demo account. The figures are illustrative.
Start tracking free
One account across web, Windows, and Android: your data stays seamlessly in sync. Sign up in seconds with nothing to install, then upload your broker CSV or enter holdings by hand.
Every feature unlocked until 5 April 2027, as a thank you for joining early
50% off Premium for 12 months after that, locked in for early adopters
Native CSV parsing for Fidelity & Interactive Investor; other UK brokers in beta
Zero credentials: we never ask for your broker or bank logins
Opens in your browser · Can be installed to desktop or mobile in 1 click
Also on Android:
Core tracking is live today · Features marked Coming soon roll out in stages
Take a closer look at the app
Real screenshots from the app, running on a demo account. Pick a screen to look around.
Your whole net worth, in one place
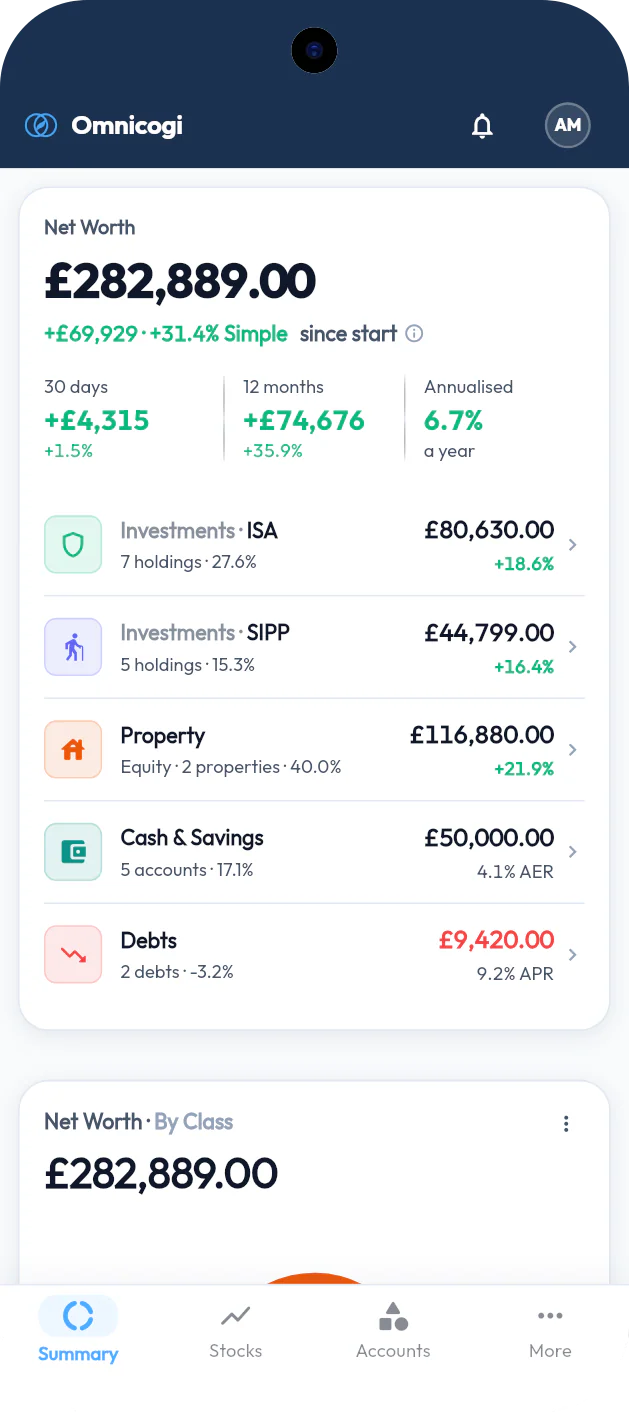
Stocks, savings and property added up on one screen, less what you owe, with what changed over the last 30 days, the last 12 months and since you started.
Demo account. The figures are illustrative.
See what your money actually earned
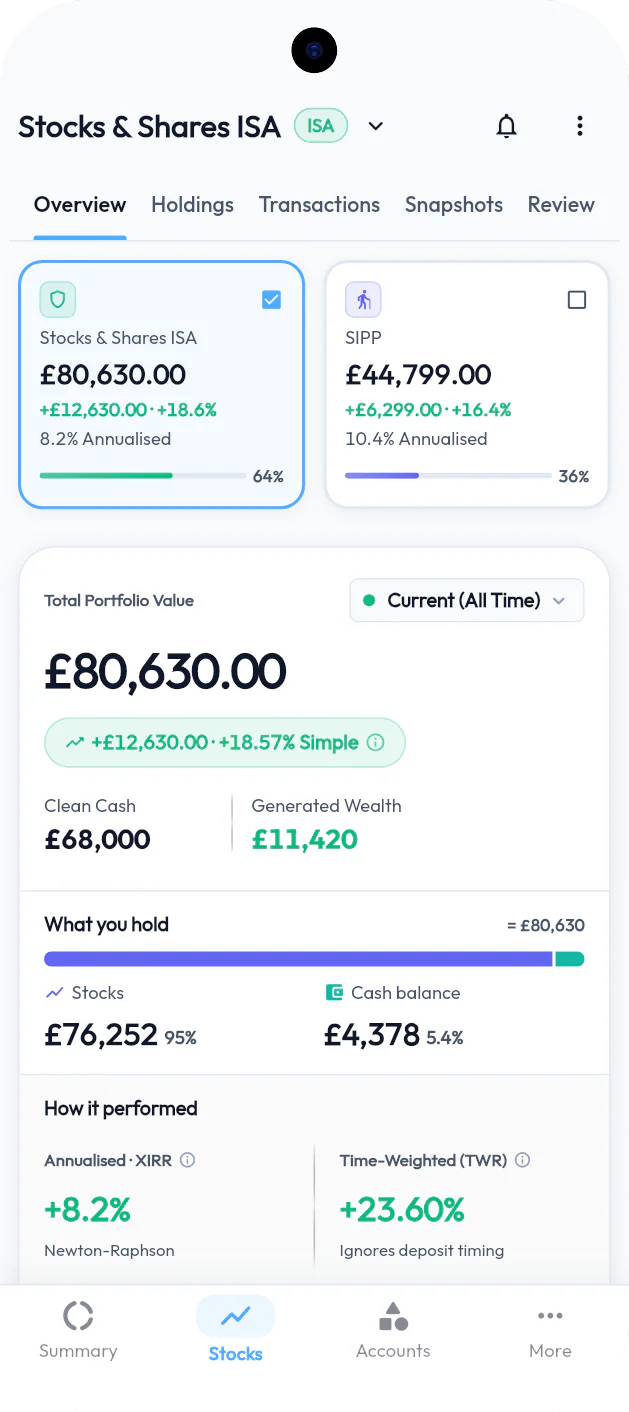
Each account splits into the Clean Cash you paid in and the Generated Wealth it made, with a true annualised XIRR, a time-weighted return, the income and fees behind the total, and a chart of the value against what you paid in.
Demo account. The figures are illustrative.
Every holding, every penny
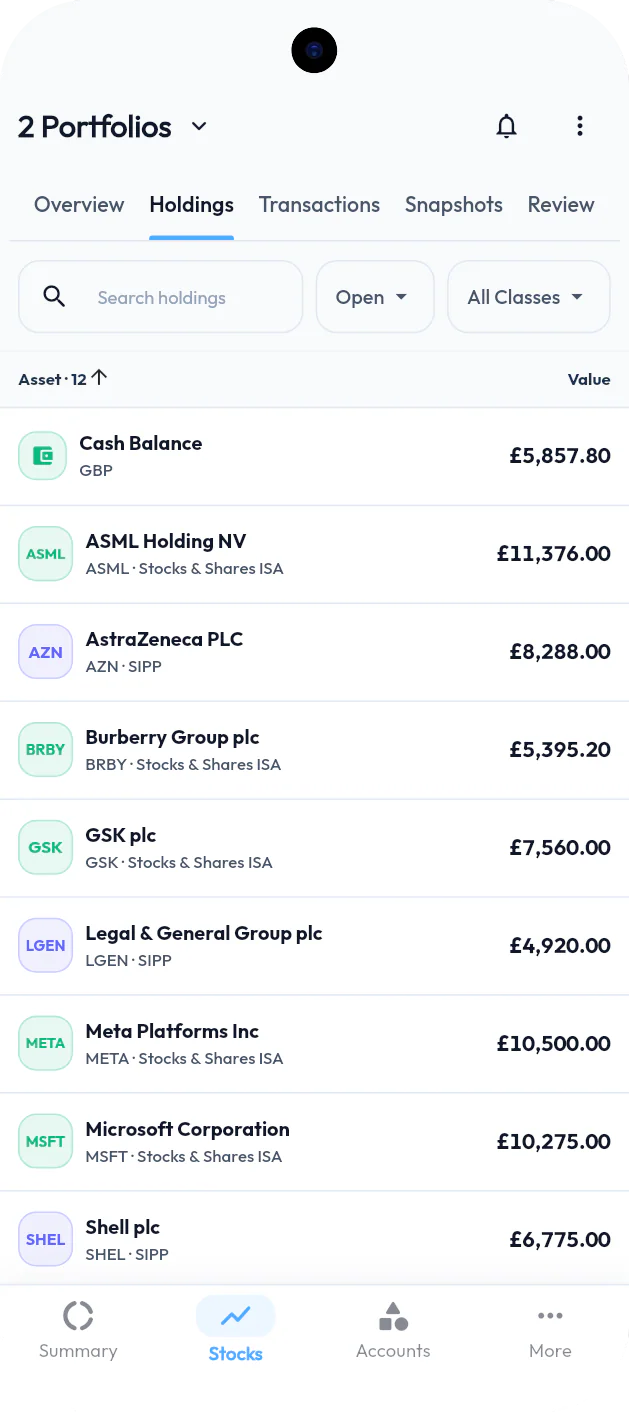
Value, gain or loss, quantity and average cost for every position across your accounts, searchable by ticker, SEDOL or name.
Demo account. The figures are illustrative.
Every transaction on one timeline
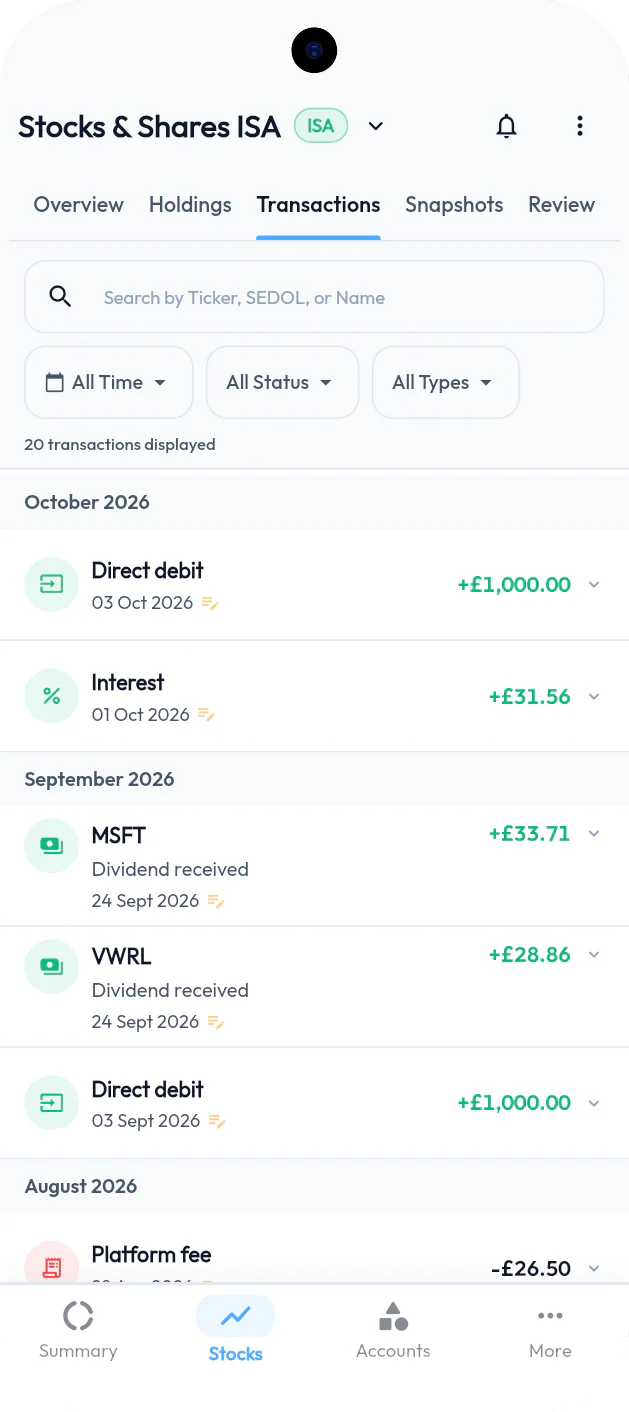
Deposits, buys, sales, dividends, interest and fees from your broker CSVs, dated and filterable, so you can check any figure back to the line it came from.
Demo account. The figures are illustrative.
How much of your ISA allowance have you used?
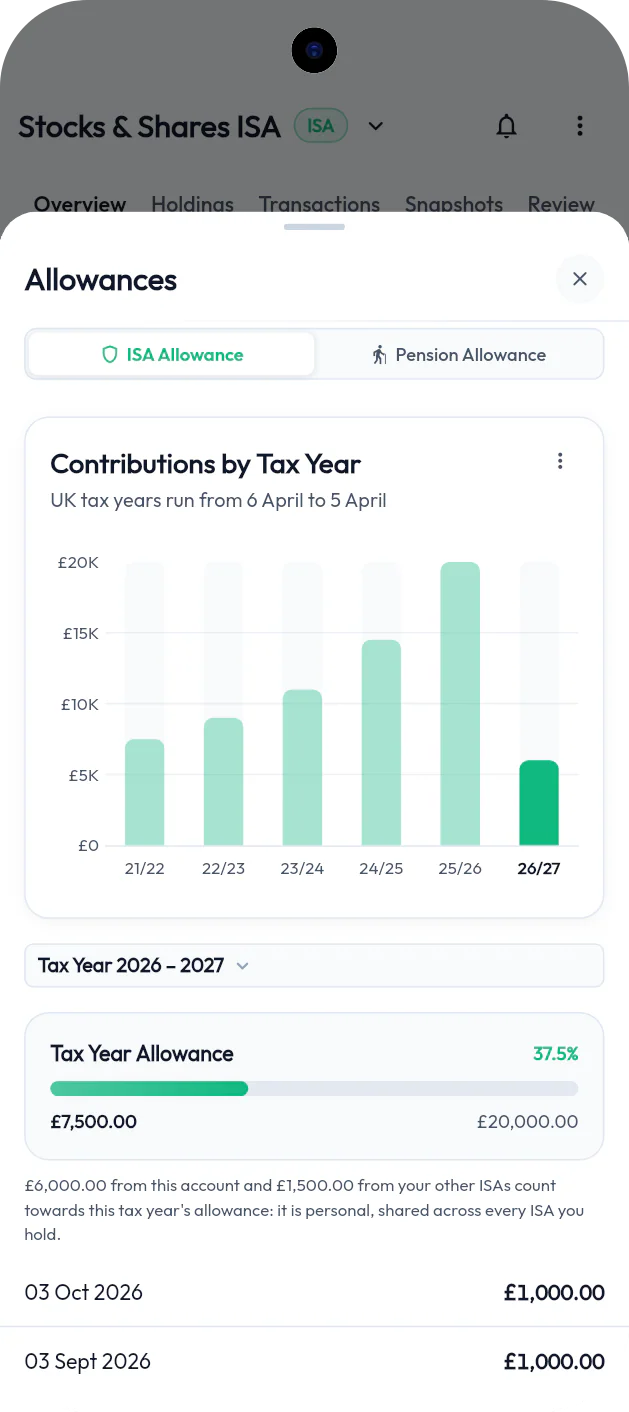
What went into your ISA in every tax year, against the £20,000 allowance, with this year's headroom and each deposit that counted towards it.
Demo account. The figures are illustrative.
Is every dividend actually reaching you?
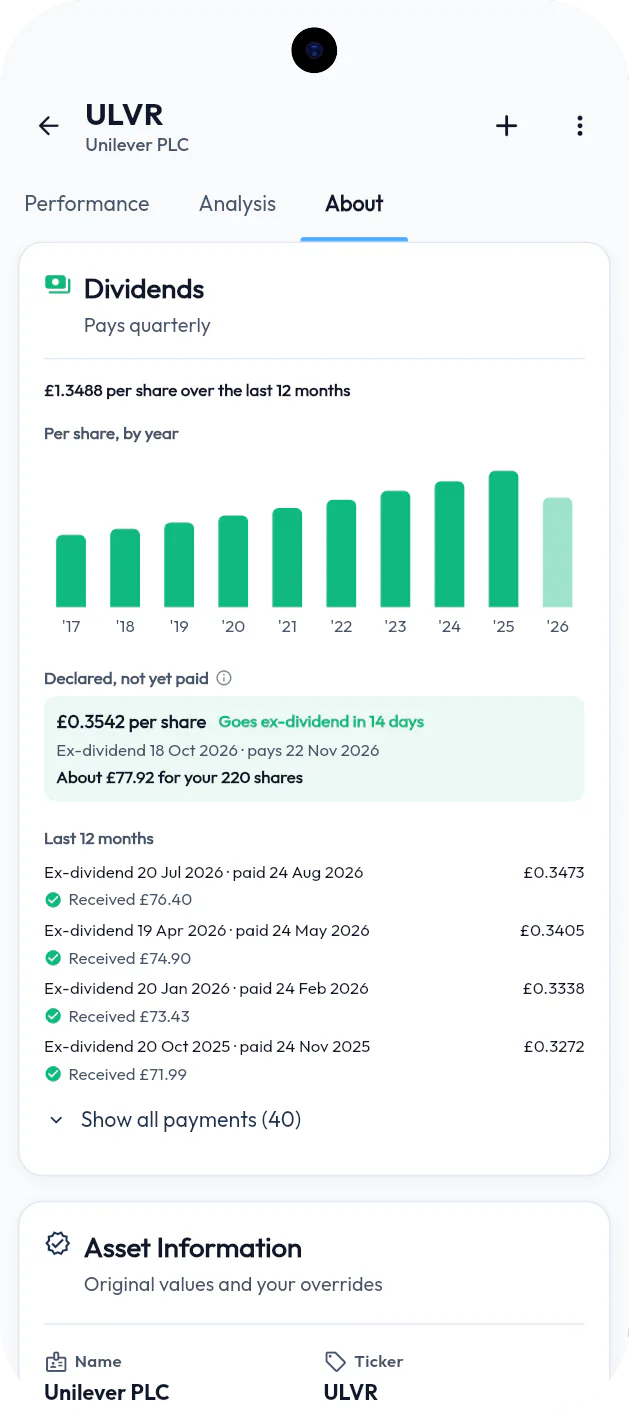
What a company pays per share, what the next dividend should pay on your holding, the pay history by year, and a tick against each payment that reached your records.
Demo account. The figures are illustrative.
Know your property equity
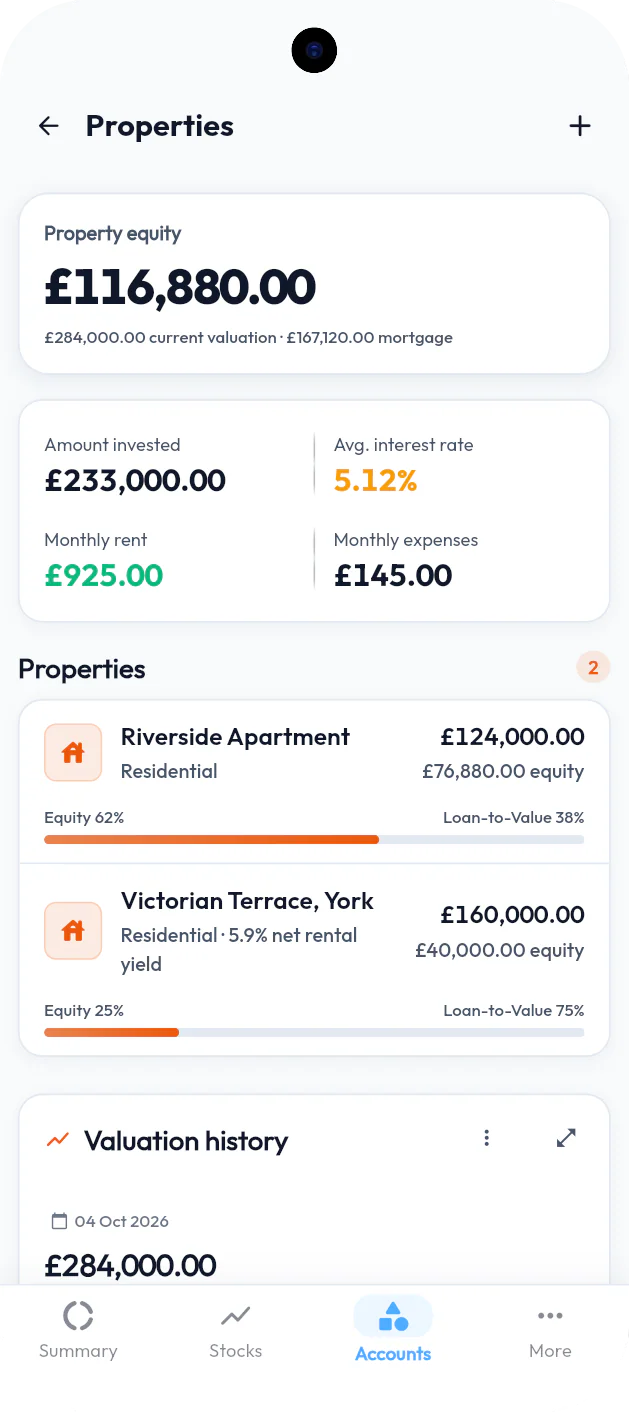
The valuation, less the mortgage, is the number that counts towards your net worth. Loan-to-value and valuation history sit alongside.
Demo account. The figures are illustrative.
Is your cash beating inflation?
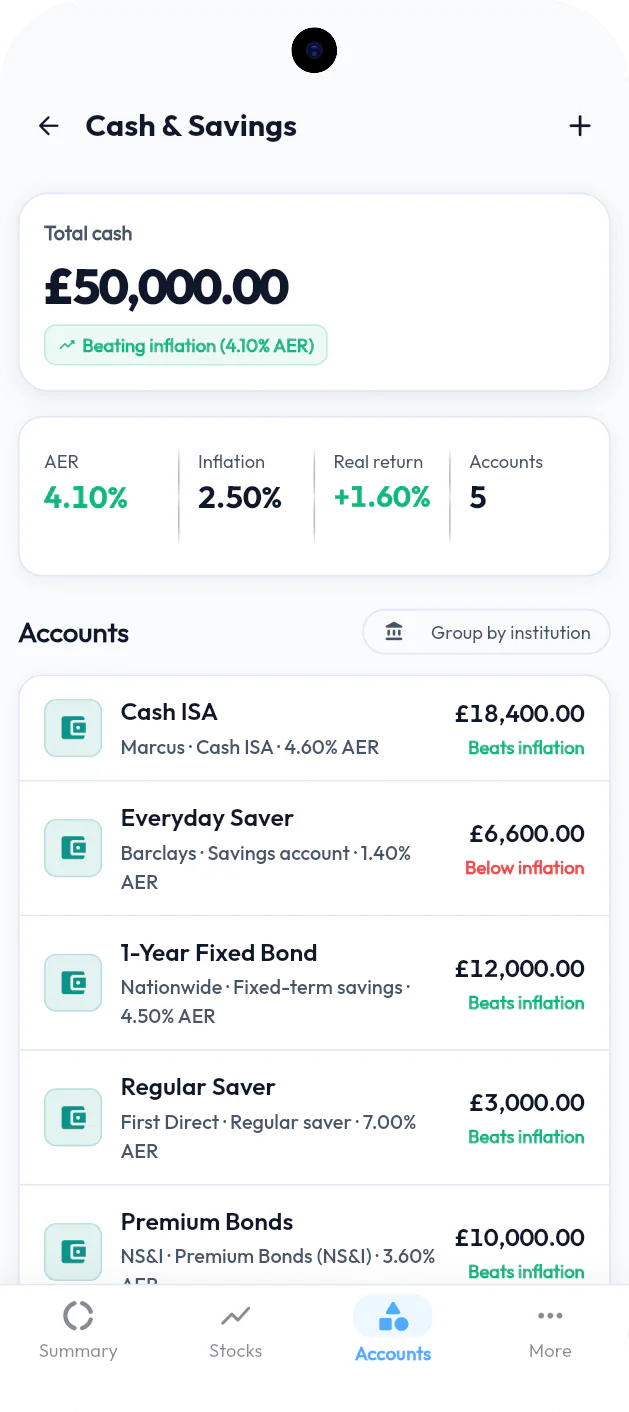
Every savings account with its AER, set against inflation, so you can see the real return on the money you are not investing.
Demo account. The figures are illustrative.
Debts, netted off
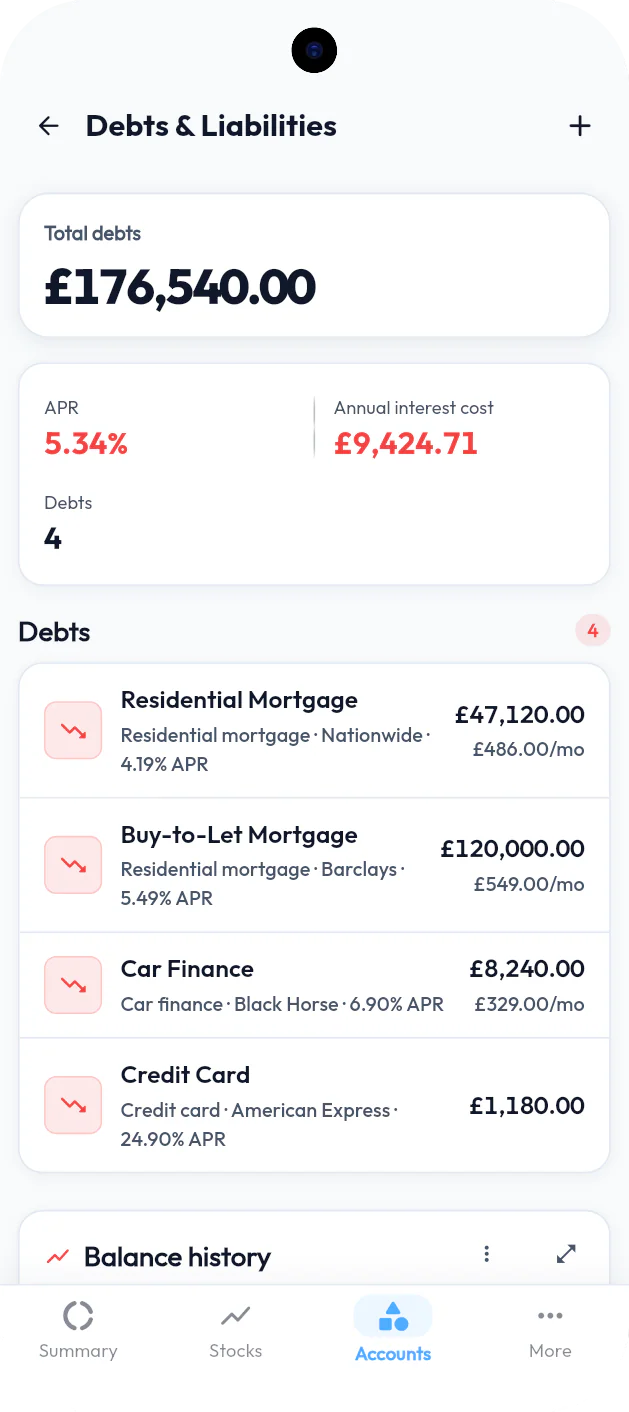
Mortgages, car finance and credit cards sit alongside everything you own, with each rate, the yearly interest they cost you and the balance over time.
Demo account. The figures are illustrative.
When could you stop working?
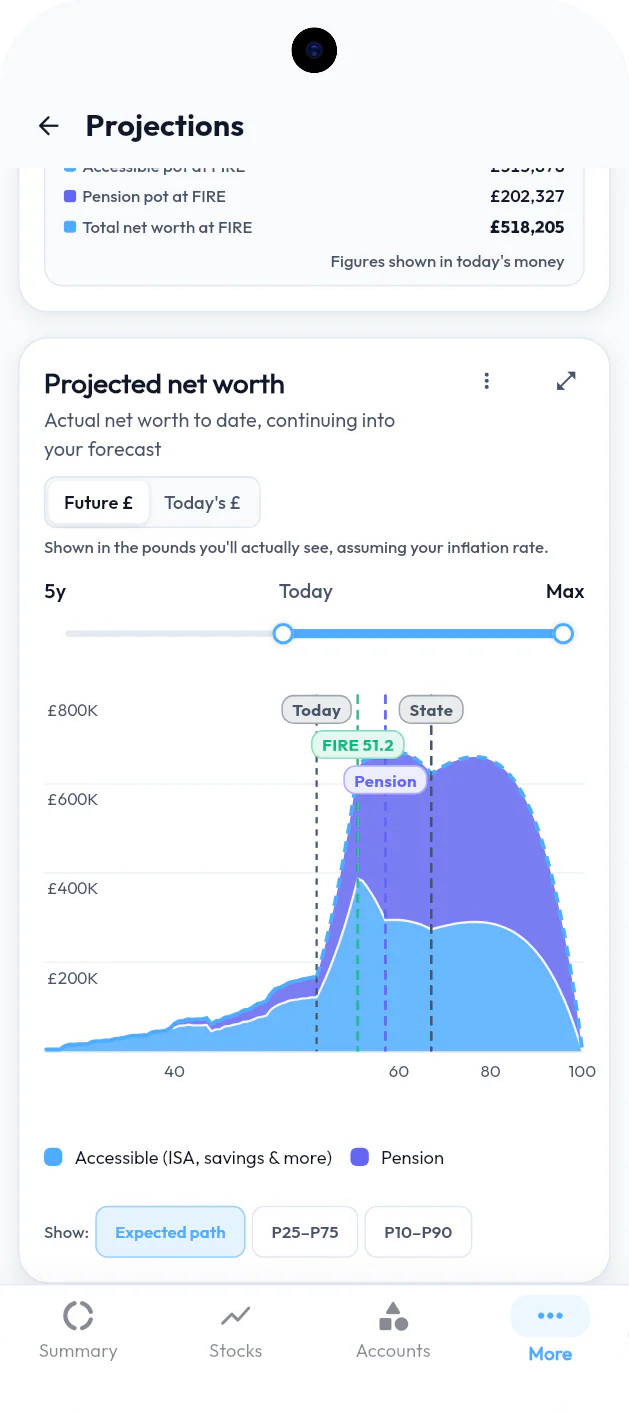
Projections chart your net worth from today to 100, split into what you can spend and what is locked in a pension, and mark the age your plan could fund retirement. Lucky and unlucky markets are run too, so you see a range rather than one hopeful number.
Demo account. The figures are illustrative.
How it works
No Open Banking and no shared passwords. You export CSVs from your broker, drop them in, and Omnicogi does the maths on its servers.
01Import
Native Parser
Drag & drop CSV parsing
No passwords or bank logins needed. You export a CSV from your broker and upload it, or enter holdings by hand. Two brokers are fully supported today; the rest import through automatic column matching while we build and reconcile their formats.
ii_trades_2024.csv Parsed
RR.BUY400 shs−£440.00
GSKDIVDividend+£47.56
02Reconcile
Coming soon
Snapshot sanity check
Snapshot Reconciliation checks Omnicogi against your official broker statements, matching holdings, cash balances and share counts so every penny of net worth is accounted for. Being switched on for beta accounts in stages.
Broker Statement
£80,630.00
Engine Ledger
£80,630.00
Holding & Cash Match: 100%
Delta: £0.00
Matches your statement
03Analyse
Returns
What you paid in, what it made
Clean Cash is what you paid in; Generated Wealth is what it made. Your return is a daily-weighted XIRR, and sold positions stay on record so you can judge old trades years later.
Clean Cash
£68,000.00
Paid in
Generated Wealth
+£11,420.00
Realised and paper gains
XIRR+7.9% p.a.
Daily-weighted · sold positions kept
Which brokers can I import from?
CSV import is in active development during Early Access. Here is exactly where each broker stands.
Tier 1 · Supported
Detected automatically and reconciled to the penny against real broker statements.
FidelityInteractive Investor
Experimental · In development
Imports through automatic column matching. You may need to map a column or two, and it is worth checking the result.
Don't see your broker? Upload your CSV export in-app and we'll map your schema in future.
Stocks, shares & pensions
Was that a good trade, or would a tracker have done better?
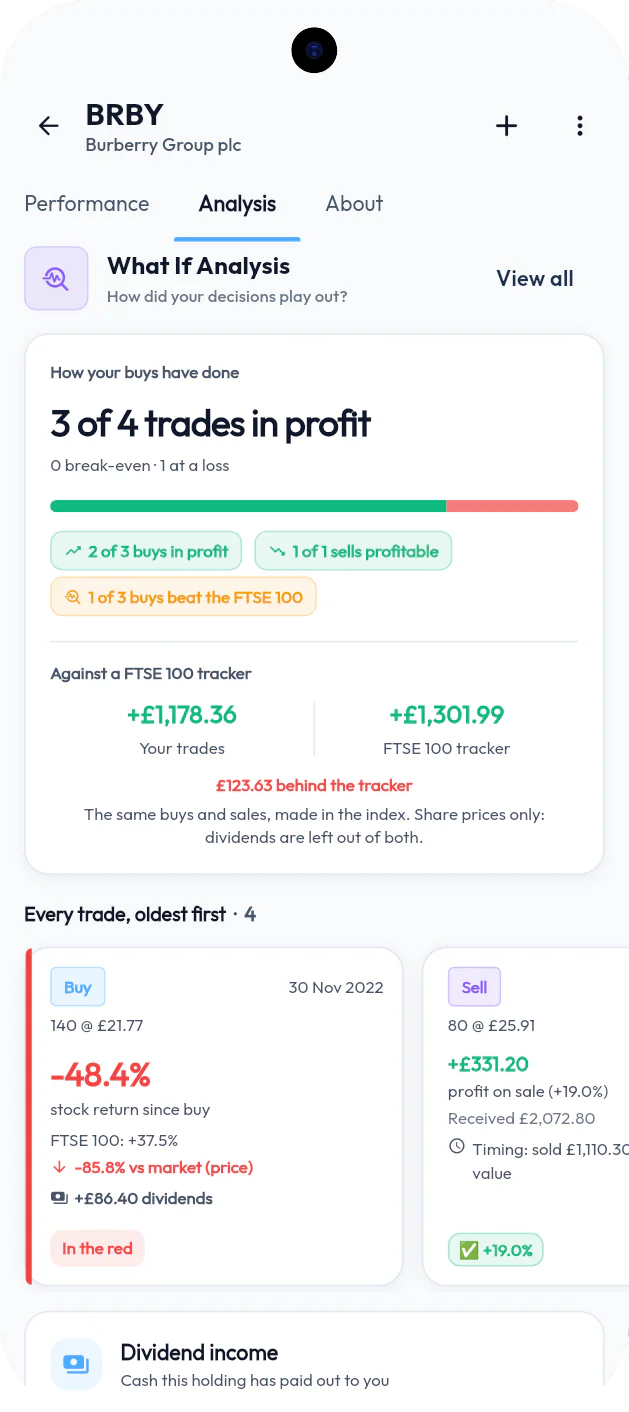
Open any holding and every buy and sale is marked on the share price, next to the FTSE 100, then set against what came next: the gain since each purchase, the profit a sale locked in, and how each one did against the index. In this demo, on Burberry's real prices, the dip bought at £6.68 is up 68% and 44 points ahead of the FTSE 100, while the first buy at £21.77 is down 48%. Across all four trades the holding made £1,178; the same buys and sales in a FTSE 100 tracker made £1,302. That is the Do Nothing Test, for a single holding. The portfolio-wide version, against the S&P 500 and MSCI World too, is coming soon.
Same money in a FTSE 100 tracker: +£1,302
Demo account: illustrative trades on Burberry's real share prices and dividends. Past performance is not a guide to the future.
Is your “total value” hiding your real profit?
Most broker dashboards and spreadsheets blend your new deposits with dividends and capital gains. The total goes up when you pay in, so it is hard to tell how your money is actually doing.
Two numbers, kept apart
Every transaction goes into a double-entry ledger, so Omnicogi can keep the Clean Cash you paid in (deposits less withdrawals) apart from the Generated Wealth it made (realised and paper gains).
Returns use a daily-weighted XIRR, which accounts for the exact date every pound went in or came out.
Easy-access and fixed savings, cash ISAs and Premium Bonds, each set against UK inflation so you can see what the money is really earning.
Cash ISA & Allowance Limits
Monitor your £20,000 ISA contribution ceiling across cash and investment wrappers.
CPI Inflation Benchmarking
Each account's AER against CPI, and the real return on your cash as a whole.
Real return after inflation+1.6%
Average AER 4.1%
CPI 2.5%
Marcus Cash ISA
4.6%
Premium Bonds
3.6%
Model your path to financial independence
When could your investments pay for the life you want? Omnicogi projects your wealth trajectory and offers optional ISA Bridge modelling to show how accessible ISA and taxable savings bridge the gap before private pension access (currently age 55, rising to 57 from 2028).
FI crossover date & net worth projections
Optional ISA Bridge modelling (bridging the gap to private pension access)
Adjustable savings rates, real returns & drawdown assumptions
51
FI crossover age
51 → 57
Bridge window
4.4%
Real return
Demo account. The figures are illustrative.
Free now. A generous free tier for good.
During Early Access every account gets everything, Premium included, until 5 April 2027. After that the core tracker stays free for good, and Premium adds the tax and planning tools, with 50% off for 12 months if you joined early.
Why it's all free right now
We are refining the ledger with real portfolios, so every account created during Early Access is fully unlocked until the end of the 2026/27 tax year. There is no card to enter and no trial clock ticking.
In return, Early Access accounts take part in our import diagnostics (uploaded CSVs are kept for up to 90 days so we can fix parsing issues and widen UK broker support). When Premium launches we intend a transparent subscription with no data selling, at £4.99/month. That is our current intention rather than a fixed price, and you will get advance notice before anything changes, per our terms.
Early adopters lock in 50% off Premium for their first 12 months once paid plans begin.
Feature
Core · free
Premium · free until 5 Apr
Net worth ledger, true XIRR & benchmarks
Holdings, live and historical
Up to 30
Unlimited
Multi-wrapper isolation (ISA, SIPP, GIA)
1 account
Unlimited
Manual asset tracking (property, cash & more)
Up to 2 assets
Unlimited
Automated Section 104 CGT pooling
PDF, Excel & CGT tax exports
ISA Bridge & decumulation modelling
Dynamic mortgage LTV & multi-currency
No broker passwords
You never share a password, 2FA code, or account access. Data enters Omnicogi only through CSVs you export and upload yourself.
Calculated on our servers
Every figure is worked out on our servers, not in your browser. Your data is yours: we never package it or sell it.
Encrypted in Google Cloud
Every transaction and uploaded record is encrypted in transit (TLS 1.3) and at rest (AES-256) on Google Cloud.
Start free in your browser, on Windows desktop, or on Android: no card needed, and never your broker or bank login. Everything is unlocked until 5 April 2027.